NetWatch
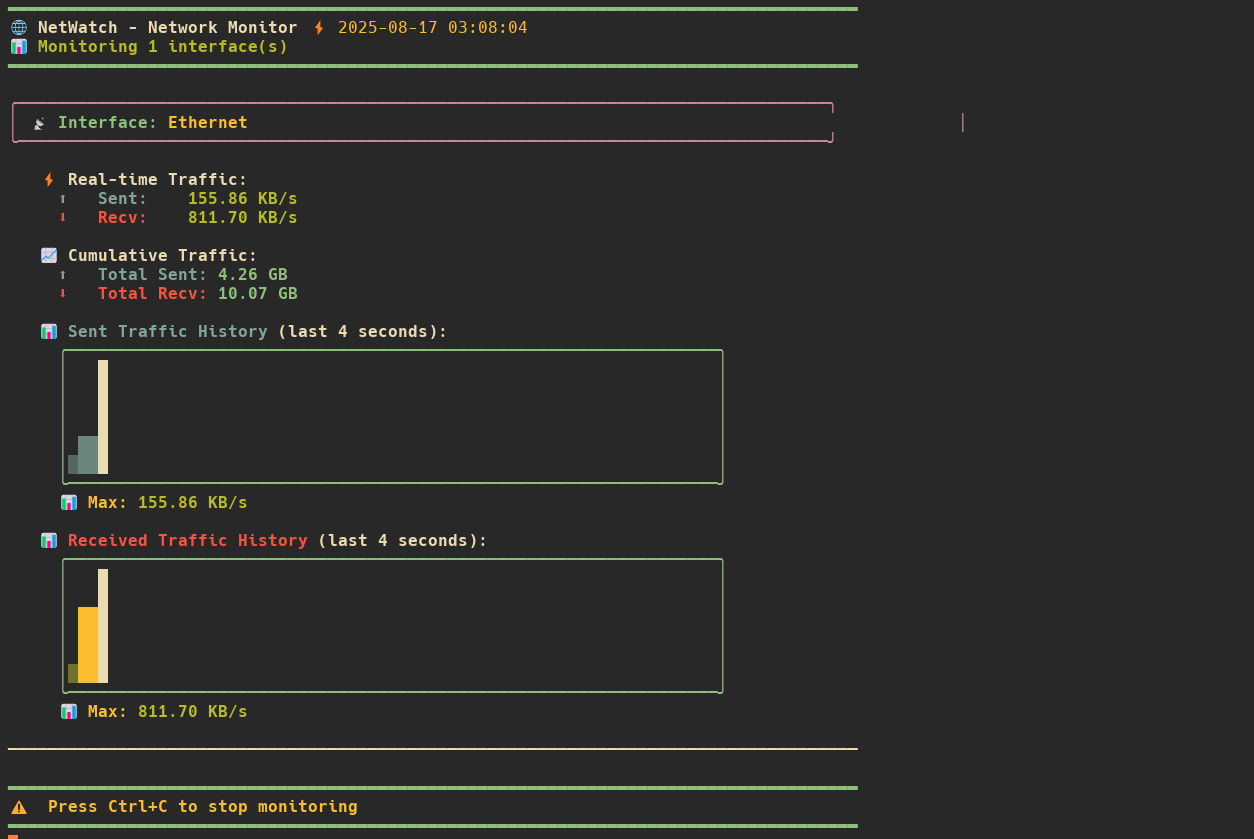
A network monitoring tool that provides real-time traffic statistics through both an interactive terminal interface (ASCII charts) and a web dashboard with dynamic visualizations.
Demo: Asciinema recording | Code: GitHub
What it does
NetWatch monitors network interface traffic in real time, displaying send and receive speeds updated every second. The terminal mode offers interactive interface selection and color-coded ASCII charts. The web mode provides a responsive dashboard with Chart.js graphs and live updates via WebSockets, with no simulated data — it shows a disconnected state when no real traffic is available.
The tool also exposes a REST API for integration with other systems, and is distributed on PyPI as netwatch-monitor.
Tech stack
- Language: Python 3.7+
- Backend: Flask, Flask-SocketIO, psutil (system network stats)
- Frontend: Chart.js, Bootstrap 5, vanilla JavaScript
- Terminal: Colorama (styled console output)
- Distribution: PyPI package (
pip install netwatch-monitor)
Key features
- Dual interface: terminal with ASCII charts and web dashboard with Chart.js
- Real-time bandwidth monitoring (send/receive) with 1-second refresh
- Interactive network interface selection
- REST API for programmatic access to interface lists and stats
- WebSocket-based live updates, no page reloads required